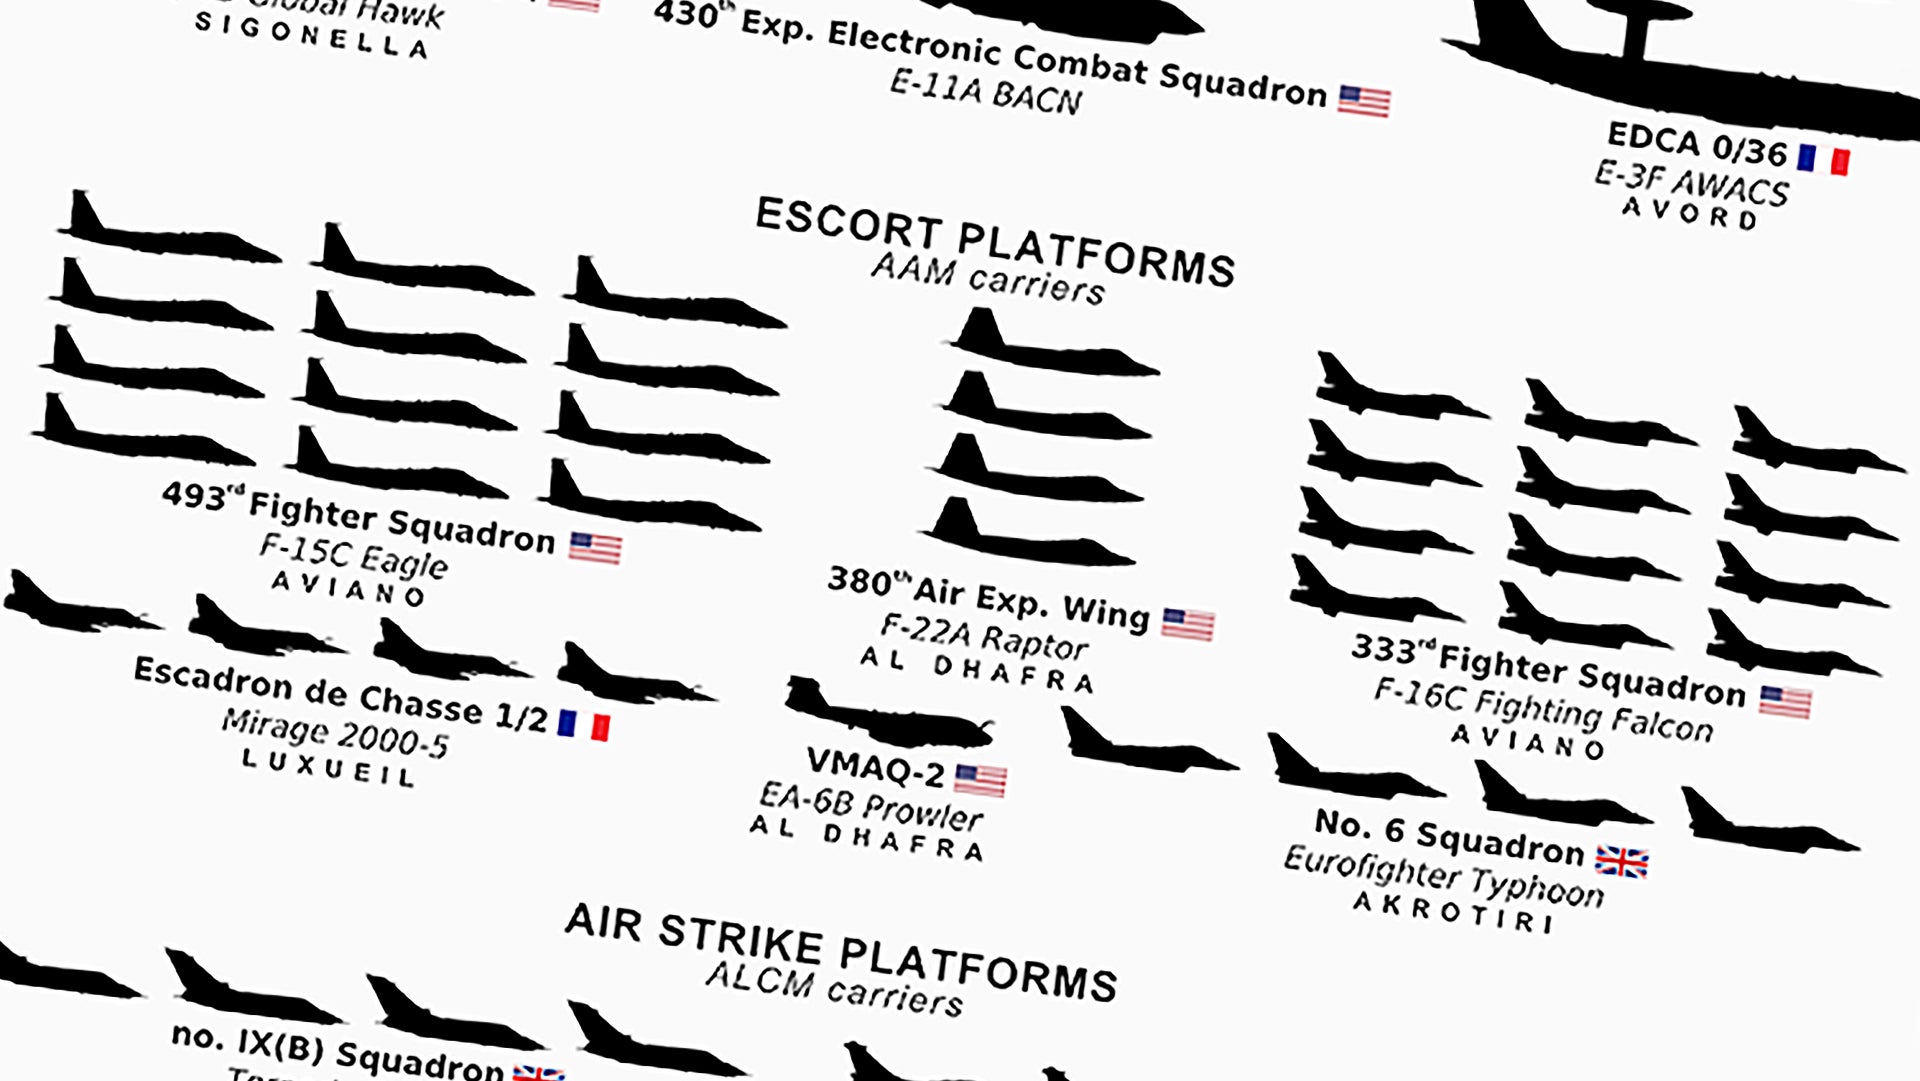
Our good friends at Contemporary Issues Geography (CIGeography) are back at it again, and this time they took it upon themselves to visualize the assets used in the April 13th trilateral cruise missile strikes on Syria.
Above all else, the chart dramatically illustrates how many support assets took part in the operation, not just so the shooters’ missiles could successfully make it to their targets, but to set up a defensive screen in the case Russia decided to respond militarily to the operation. This chart largely vibes with our real-time marathon and after-action coverage of the event.


This chart will likely be revised a bit in the coming days as there are a few disputed components, such as the E-11 Raven which some sources say was just repositioning from Afghanistan to Europe at the time. Additional surveillance assets may also be added, and the name of the F-16 unit involved in the mission appears to be a typo, it should be the 555th ‘Triple Nickle’ fighter squadron based out of Aviano. But aside from those small discrepancies, this chart is far better than anything the DoD or other allied commands involved in the operation have released.
A big thanks once again to CIGeography for their amazing work, and remember you can buy these charts in poster size for yourself or for the defense or aeronautical nut in your life. Our analysis of the mission is almost complete and should be posted in the coming days, so stay tuned for that as well.
Contact the author: Tyler@thedrive.com
